Medical results are not always easy to understand—and the risk statements that come with them perhaps even less so. Communicating statistical information to patients is no easy task.
A team of scientists from the domains of medicine, medical education, and mathematics education at LMU has published a study in the journal PLOS ONE investigating how communication between doctors and patients about actual risks can be made more effective.
After all, it is not always easy to grasp what certain numbers really mean. “Even doctors sometimes have difficulties in determining the right predictive value. And if the data is difficult for the doctor to interpret, it’s even harder to communicate the information accurately to patients in a way they will understand,” says mathematics educationalist Karin Binder one of the authors of the study.
The following case will serve as an example: A patient has just received a conspicuous sonographic finding of his thyroid. Does this mean he has thyroid cancer? Not necessarily, because there is a certain probability that the result of the examination will be positive even though the patient does not have thyroid cancer.
To explain to patients what the statistical picture looks like after such a positive test result, there are two approaches. One of them requires some lateral thinking, while the other is much easier to interpret from the patient’s perspective, as the researchers were able to demonstrate.
Bayesian vs. diagnostic information
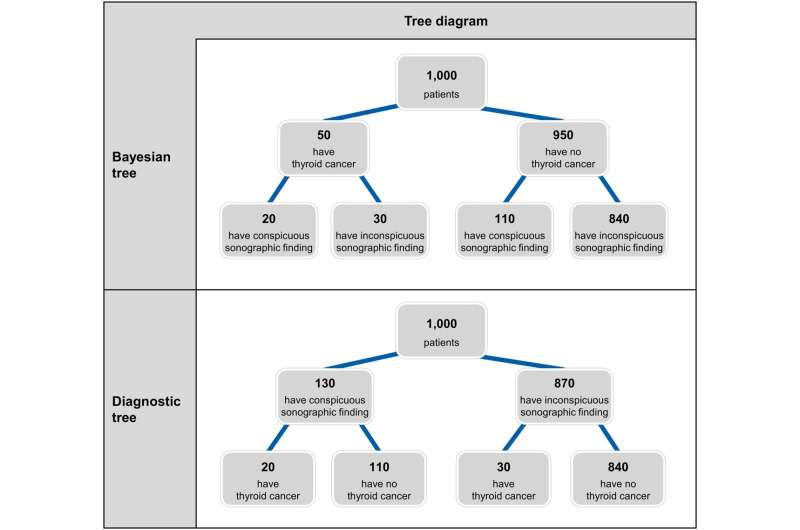
The commonly used Bayesian approach proceeds from the number of patients who actually have the disease. First of all, the doctor explains how frequently the disease occurs overall—for example: “out of 1,000 patients, 50 have thyroid cancer.” Then the doctor lays out: a) for how many of these patients with thyroid cancer, the test result is positive (20 out of 50) and b) how many people who do not have thyroid cancer nonetheless have a positive test result (110 out of the remaining 950).
This is generally the information the doctor either knows or can easily research. Positive tests as a proportion of people with the disease is also known as sensitivity—a term we may be familiar with from the COVID-19 pandemic, when it was used, for example, as a quality criterion for rapid tests. Unfortunately, however, positive tests as a proportion of people with the disease is often confused with people with the disease as a proportion of positive tests! And these two percentages can greatly differ depending on the situation.
So what do the numbers quoted above mean in relation to a person with a positive test result? How many people who test positive actually have the disease? If for you the answer is not immediately apparent, you are not alone: Without further information, only 10% of participants were able to calculate how many people with positive results actually had the disease.
“Diagnostic” communication of information proceeds very differently: First of all, the doctor explains how many patients have positive test results, irrespective of whether they actually have the disease or not. In our example, this would be 130 people with a conspicuous thyroid ultrasound (out of 1,000 people examined). Next, the doctor explains how many of these people with positive tests actually have the disease (20 out of 130) and how many of the people with negative test results have the disease (30 out of 870).
The relevant information is contained here directly and without the need for mental arithmetic: If my result is positive, then the probability is a 20 out of 130 that I actually have thyroid cancer. When communicated in this form, 72% of study participants were capable of arriving at this conclusion, compared to 10% with the Bayesian approach.
What is the best way of communicating statistical information?
“With Bayesian communication, moreover, participants were considerably slower in reaching the correct result, if they got there at all,” says Karin Binder. “And in busy doctor’s offices and hospitals, this time is often not available.” The team of authors therefore calls on doctors to use diagnostic information communication more readily in future. This would go some way to avoiding confusion, misinterpretation, and wrong decisions.
It would be even better, however, to take the time to give patients a full picture of the situation, containing both diagnostic and Bayesian information. Only this can explain the surprising phenomenon whereby even a medical test with outstanding quality criteria can have very limited predictive power under certain circumstances (e.g., routine screenings).
More information:
Sarah Frederike Brose et al, Bayesian versus diagnostic information in physician-patient communication: Effects of direction of statistical information and presentation of visualization, PLOS ONE (2023). DOI: 10.1371/journal.pone.0283947
Journal information:
PLoS ONE
Source: Read Full Article
